// Analysis, Benchmarks, and Automation
Portal solutions for strategic and operational use

Loyalty card data
In the future, customer access and knowledge of customer needs will determine the success of a company. Our CRM tool supports you in customer analysis and offers the possibility to automate customer-specific approaches. Find out more about our Customer Analysis Portal (KAP).

ERP / Merchandise Management
The necessity to analyse ERP data, costs or personnel key figures has been recognised by almost all retailers by now. Nevertheless, the implementation often fails. With our tools you can evaluate and analyse your stores, suppliers, articles, costs and much more!

eCommerce data
In a holistic approach, hachmeister + partner combines stationary benchmarking with next-generation eCommerce benchmarking. Evaluate your current performance measurements against the best in the industry and compare your social media activities by searching and assessing your competition.
New analysis dimension through article attributes
"We process several 100 million data sets every day. In the process, we validate, standardise and refine the data and calculate more than 30 statistically highly valid benchmarks. We enrich the individual item level with additional attributes so that trends can also be analysed (skinny jeans, short pullovers, etc.)."


Christian Hoffmann
Head of ETL & Big Data
hachmeister + partner


Our data pool: over 2.300 POS and 3.4 million loyalty cards
Based on the largest retail database for the German-speaking region, we offer benchmarks for the market as well as for individual peer groups. With the help of h + p's own SaaS portals, potentials can be identified by various stakeholders - retailers, manufacturers as well as verticals - and implementation recommendations can be derived. Our benchmarking is a holistic approach and starts deep inside your processes. By means of comparable top benchmarks and subsequent process optimisation, you advance into completely new performance categories.
The objective of h + p in the area of benchmarking is the generation of individual target values. A multitude of influencing factors are taken into account, e.g. company size, company structure, managed product ranges, price genre, external influences.
By comparing your company value with the benchmark, development potentials are determined and visualised. Based on the identified potentials, strategic goals are derived together with our consultants, which are then operationalised via master plans.
// Retail
hachmeister + partner Analysis Portal
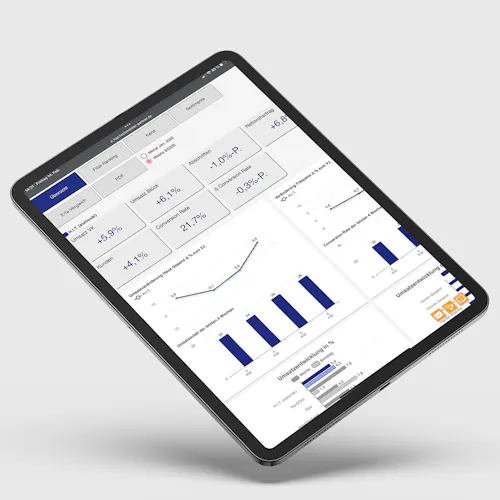
The analysis of key figures and performance metrics is taking place at an increasingly detailed level—both in terms of the time period under review and the depth of analysis.
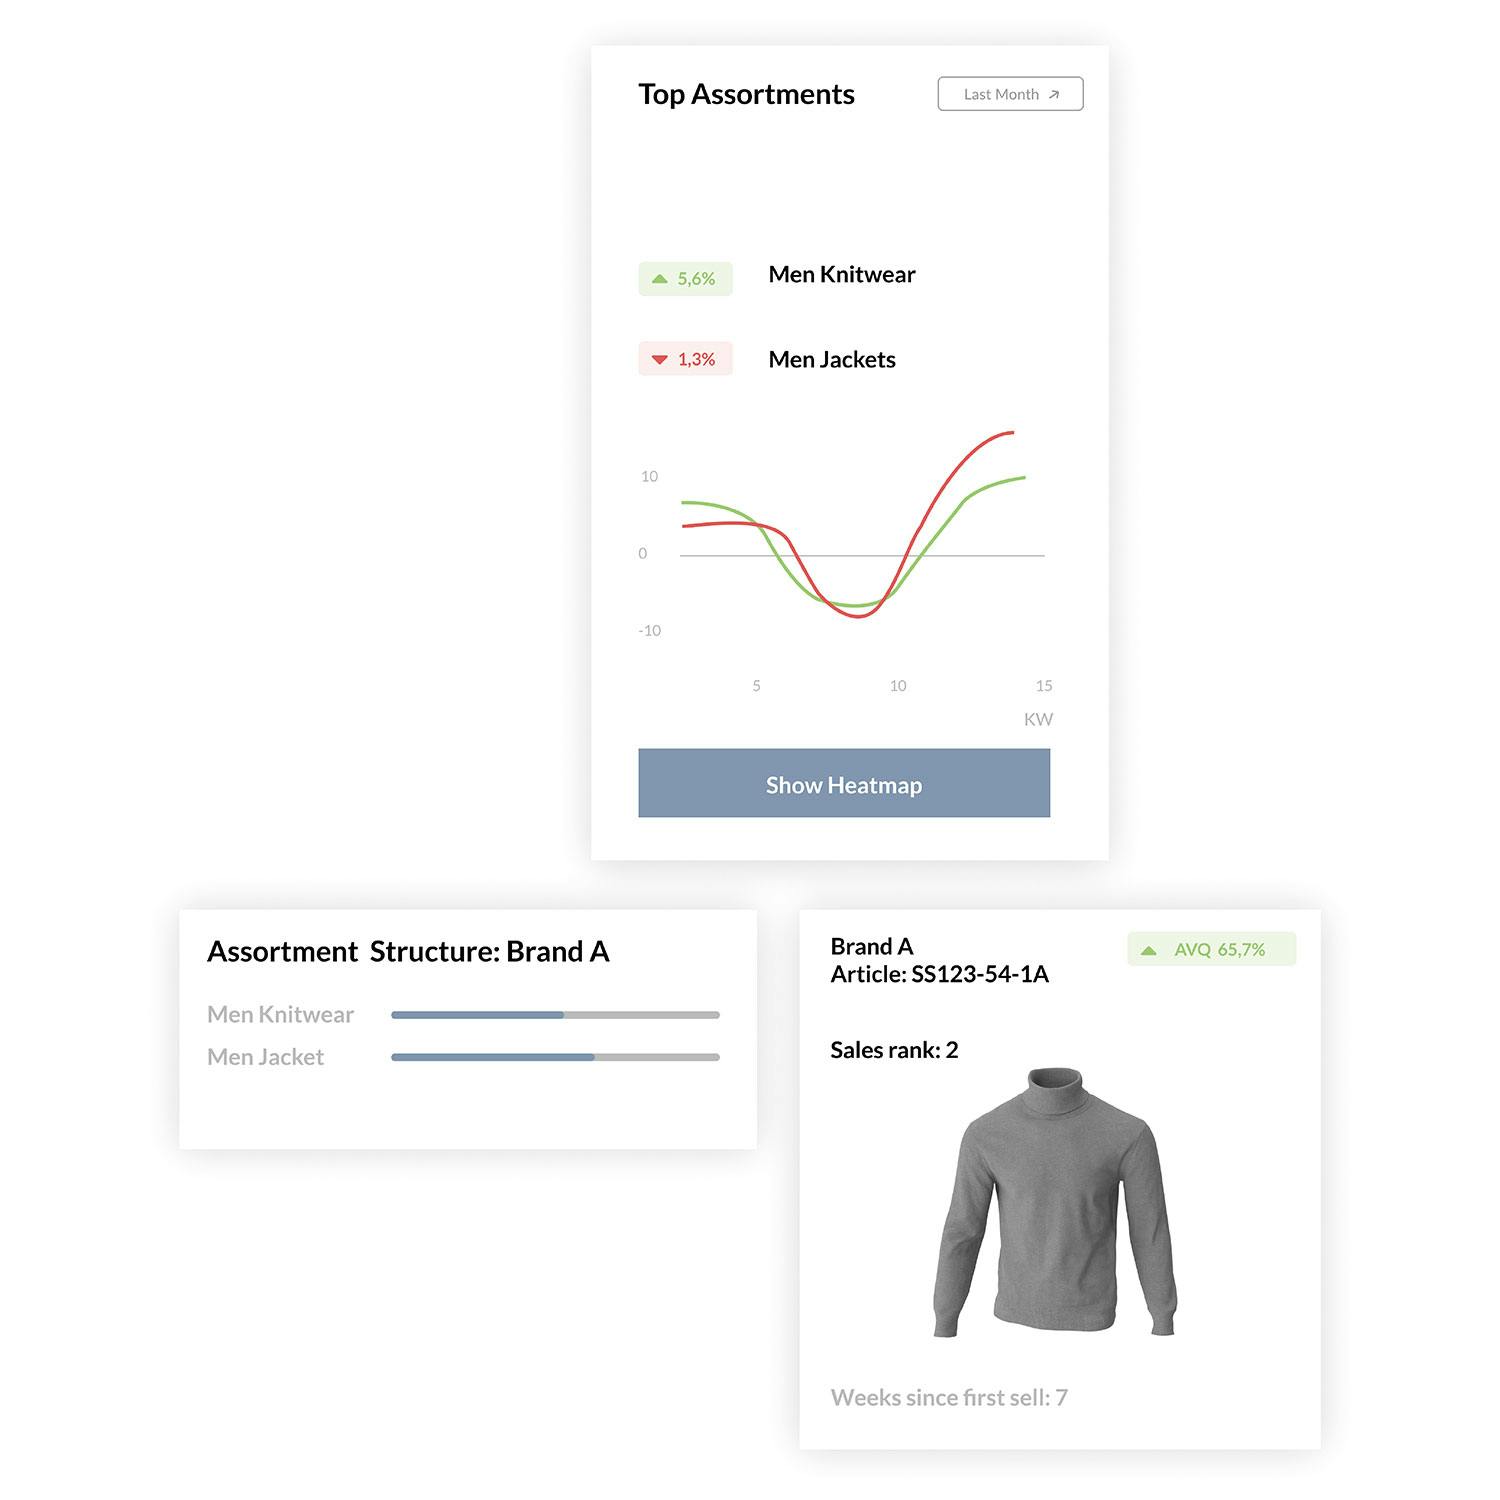
With our article analysis, you can compare the performance of your own products (including a drill-down by size and color) against the h + p benchmark. We have placed great importance on the interactivity of this analysis tool. This makes it possible to display your own best-selling and slow-selling items (or those of the benchmark) for specific product lines, colors, sizes, and brands.
- Company Comparison
- Product Line Structure and Analysis
- Brand Analysis
- Business Metrics




// Retail
CRM analysis
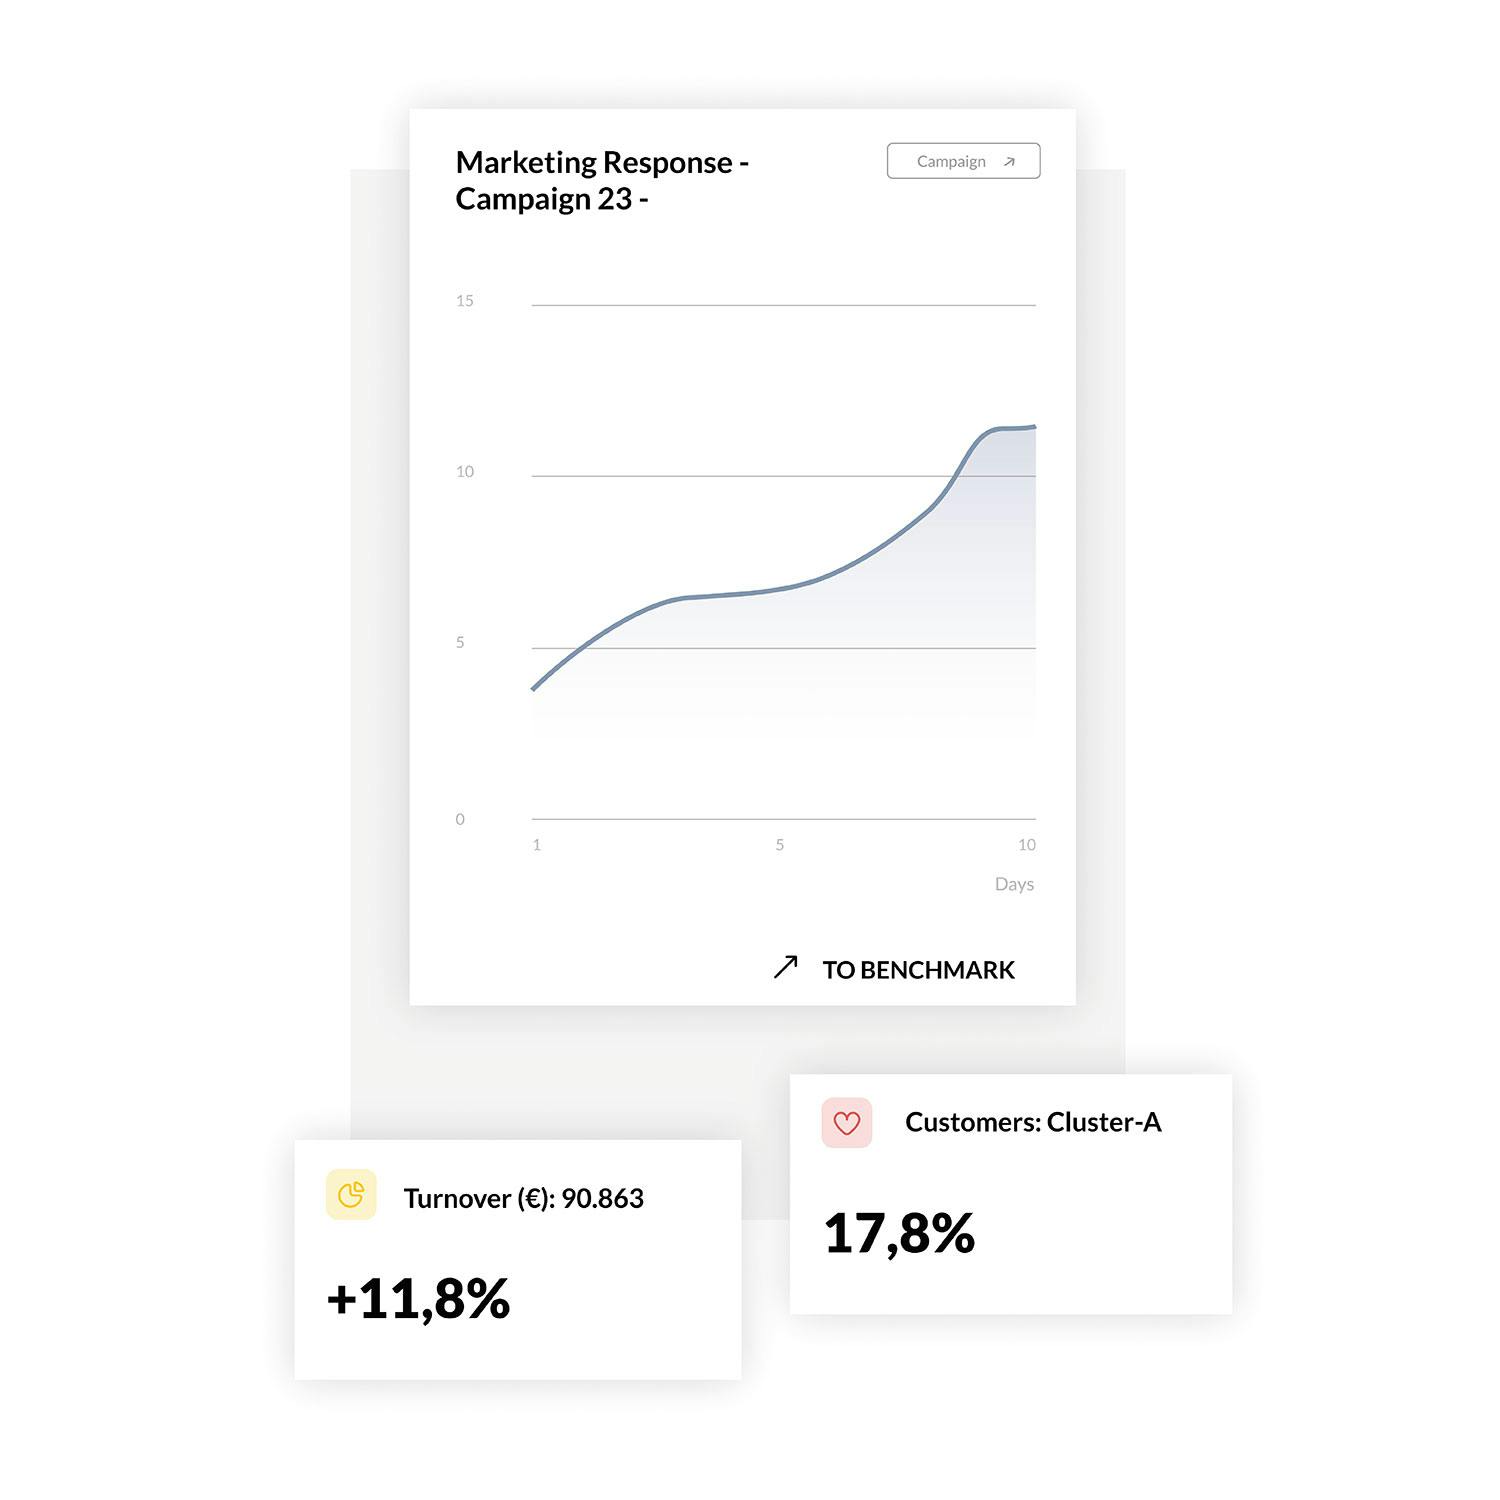
The hachmeister + partner customer analysis portal (KAP) analyses your own customer card data continuously as well as profoundly and links it to the respective benchmarks if desired. With our CRM analysis portal you identify lost customers and address your top customers in a targeted manner.
- Marketing automation and analytics
- Shopping cart analysis and cross-selling
- Map visualization and CRM cube for selective analysis
- Brand universe and purchase probabilities
- Integrations with numerous customer apps and email tools
// Retail
Marketing automation
Targeted marketing has become much more important in recent months. Many retailers have developed an awareness that a customer card can be more than just an incentive tool - it also offers an opportunity to stay in touch with their customers.
In particular, those who target their customers and analyse their buying behaviour benefit. Especially with A-customers, the approach should be perfect.
Our customer analysis portal
// Contact
Contact us now
Our experts from the areas of consulting, benchmarking and solutions are available to answer your questions with interdisciplinary and industry-specific knowledge.

Mirko Torbrügge
+49 162 2873 741
mtorbruegge@hachmeister-partner.de

// Brands
Competitive Intelligence auf einem neuen Level
With the Competitive Intelligence Portal (CIP) from hachmeister + partner, you receive an up-to-date overview of your brand's performance in the h + p benchmark at any time, as well as detailed information on the status quo and developments in the competition.
Detailed analyses and selected KPIs in the CIP dashboard give you an insight into the current changes in the market and allow you to compare your brand with benchmarks or relevant competitors.
In our article analyses you can view the best-selling articles in the h + p benchmark. Let yourself be inspired by which articles of certain brands perform particularly well.
Our interactive portal allows you to use various filter options (e.g. season vs. NOS) and rankings, for example to sort by the best LUG or the best AVQ. It is also possible to display shopping baskets (brand combination purchases at item level) of selected brands.
Within our end customer analyses we can, for example, analyse how the age frequency distribution of your brand's end customers compares to the competition. We can also analyse shopping baskets and purchase probabilities of brands and product ranges.
With us, you can analyse cross-selling potentials and, in a further step, see which brands your customers tend towards.
The data is available to us at item level. This has the advantage that we can evaluate the sizes in addition to the individual articles and their attributes.
In our size analyses, we answer questions about size requirements, but also analyse the potential of plus-size collections.
"The market says yellow is the colour of summer." Statements like these are often made on the basis of gut instinct without any factual underpinning. The h + p team can actually analyse how colour shares of individual assortments shift even within the season and how well they sell.
What makes benchmarking at h + p special?

The h + p benchmarking analyses are based on a unique retail database with more than €7 billion in sales volume. We analyze key performance indicators not in isolation, but within the context of product assortment structure, inventory management, CRM benchmarking, and marketing analysis. This results in realistic performance evaluations rather than theoretical benchmarks.
What are the benefits of benchmarking for my company?

In which areas can benchmarking be used?
How can I use benchmarking to inform strategic decisions?
// More tools

